July 2021
Mid-Year 2021 Market Watch
NAI Hiffman is pleased to present the Mid-Year 2021 Market Watch, a first look at the market statistics for the Chicago metropolitan office and industrial real estate markets.
Industrial: Insatiable Demand Spurs Supply to Try to Keep Pace

While the industrial Chicago real estate market had stayed resilient through a full calendar year of pandemic, it truly found another gear in the second quarter of 2021. The total vacancy rate at mid-year was 5.28 percent. This rate decreased 48 basis points quarter-over-quarter from the 5.76 percent recorded in the first quarter of 2021, despite the completion of over 6.5 million square feet of new product. Furthermore, the vacancy rate decreased 87 basis points year-over-year compared to the 6.15 percent recorded at mid-year 2020.
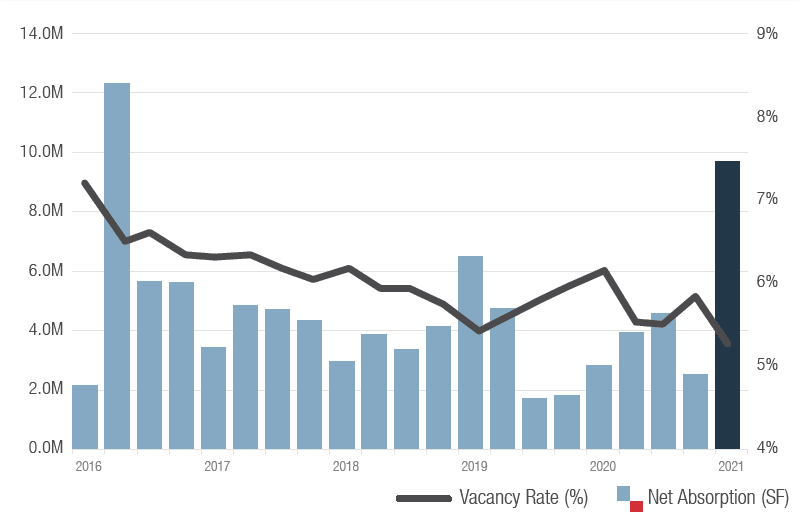
- None of the 21 submarkets across the Chicago metro area recorded a double-digit vacancy rate at mid-year.
- Leasing activity remained strong in the second quarter, as nearly 14.2 million square feet of deals were recorded.
- Chicago industrial recorded nearly 9.7 million square feet of move-ins in the second quarter of 2021.
- The Chicagoland industrial development pipeline is marching lockstep with the rest of the market fundamentals to try to meet the insatiable demand. There are currently 68 developments underway throughout the market, accounting for nearly 27.3 million square feet in the offing.
Detailed statistics and commentary are available in the Industrial Market Watch; click below to download the full document:
Suburban Office: New Leasing Activity Velocity Gains Momentum

Suburban Chicago office recorded 1,434,843 square feet of new leasing activity in the second quarter – the strongest amount since the nearly 2.2 million square feet recorded in the first quarter of 2020. The East-West Corridor submarket led the way amongst its peer suburban submarkets with 515,607 square feet of activity; the North Suburban submarket placed a comparatively strong second place with 361,173 square feet.
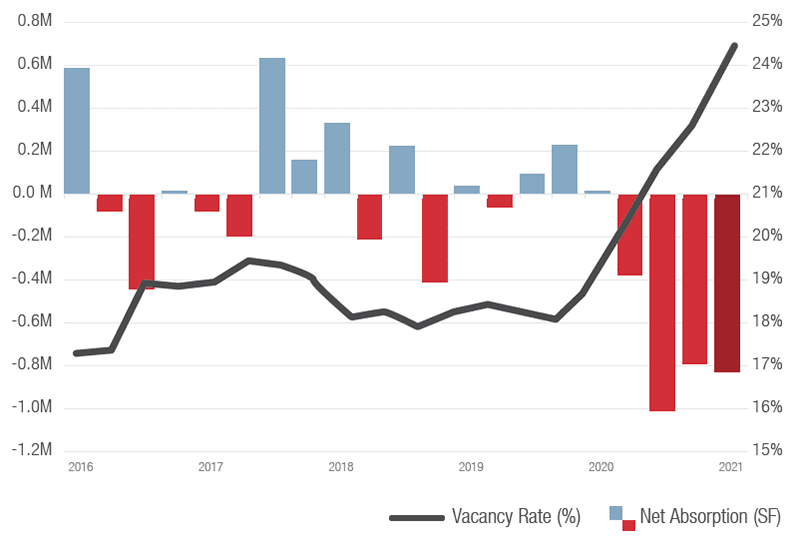
- The suburban Chicago office market recorded a 24.63 percent vacancy rate at mid-year. This rate increased 539 basis points year-over-year from the 19.24 percent vacancy rate recorded at mid-year of 2020. This rate also reflected an increase of 138 basis points from the first quarter 2021 vacancy figure of 23.25 percent.
- There was -826,912 square feet of net absorption recorded in the suburban office market in the second quarter. For the fifth consecutive time since Q2 2020, the suburbs performed better in this category than the downtown office market.
- New leasing activity topped one million square feet for only the second time in five quarters. With the National Bureau of Economic Research declaring the COVID-19 recession to be the shortest, yet steepest on record, there is continued hope that pent up consumer demand and the general population’s access to vaccines will speed up the economic recovery in the second half of 2021.
For full statistics and commentary, download the Suburban Office Market Watch.
Downtown Office: Supply Pressures Dampen Downtown’s Recovery, For Now

Despite Chicago moving to Phase 5 of its pandemic response in the first half of June, allowing businesses to operate at full capacity for the first time since the onset of COVID-19, the CBD office market has yet to find its pre-pandemic footing. The downtown vacancy rate at mid-year was recorded at 17.22 percent. This rate increased 147 basis points quarter-over-quarter from the first quarter vacancy rate of 15.75 percent. More notably, the vacancy rate has increased 456 basis points year-over-year compared to the mid-year 2020 vacancy rate of 12.66 percent.
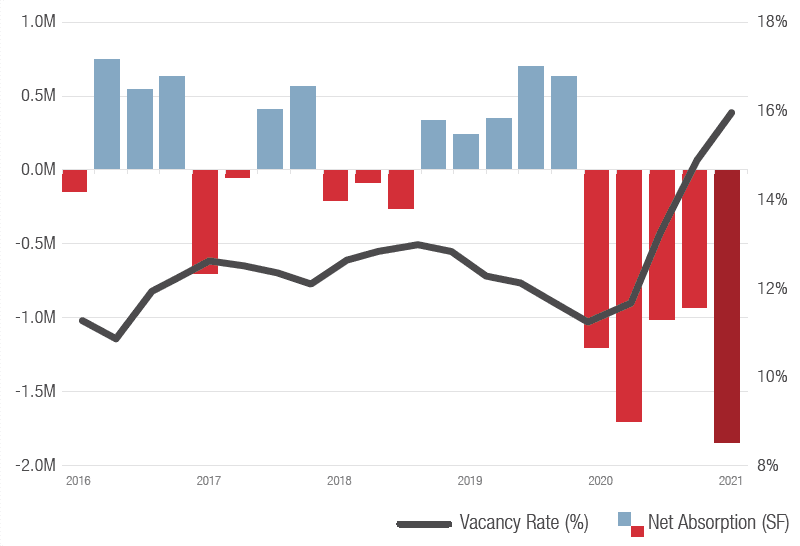
- There were another -1,843,567 square feet of net absorption in the second quarter downtown. Four of the last five quarters have had net absorption greater than -1,000,000 square feet.
- There was 1,125,130 square feet of leasing activity downtown in the second quarter.
- Despite a 5.0 percent increase in new leasing activity year-over-year, the downtown office market remains far afield from the hearty fundamentals shown at the start of 2020. As news reports trickle out regarding the return-to-office plans of corporate America, increased leasing velocity is unlikely to return before Labor Day.
Download the CBD Office Market Watch for full statistics and commentary.
Contact Us
For further information regarding the content of this market peek, please contact:
Mike Morrone
Research Director
630-693-0645
mmorrone@hiffman.com