November 2021
Suburban Single-Story Office Market Report: Third Quarter 2021
The Largest Single Quarter of Net Absorption in the Last Five Years
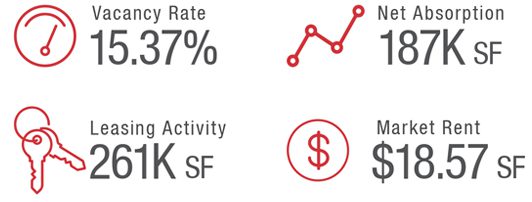
The single-story suburban office market recorded 186,707 square feet of net absorption in the third quarter of 2021, the second consecutive quarter of positive net absorption. The third quarter figure was the largest since the 197,197 square feet tallied in the third quarter of 2016. Three submarkets recorded positive net absorption on the quarter, led by the 187,145 square feet tallied in the East-West Corridor. The I-55 (29,257 square feet) and O’Hare (20,086 square feet) submarkets were also in the black. As a result of this increased pace of move-ins, the suburban single-story market had a 15.37 percent vacancy in the third quarter.

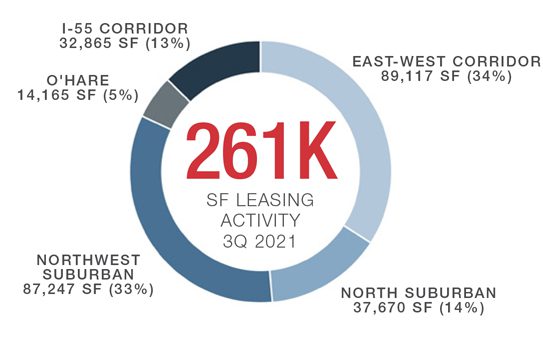
- There was 261,064 square feet of leasing activity in the suburban single-story office market in the third quarter across 122 deals, the second consecutive quarter where over 120 transactions were signed.
- There has been 830,621 square feet of leasing activity year-to-date in 2021 across 348 deals, a 24.1 percent increase compared to the 669,412 square feet signed across 240 transactions through the first nine months of 2020.
- While some may attribute this improvement to lessening headwinds from the initial onset of the Covid 19 pandemic, year-to-date activity in 2021 has increased 29.7 percent compared to the 640,270 square feet of activity across 267 deals tallied in the first nine months of 2019. Suburban single story office performance so far in 2021 is on par with the 806,774 square feet of deals signed across 328 transactions in the first nine months of 2018.

Additionally, the report includes a highlight of the Eastern East-West single-story market, which recorded a 15.50 percent total vacancy rate in the third quarter of 2021, a decrease of 335 basis points quarter-over-quarter from the 18.85 percent vacancy rate tallied in the second quarter of 2021.
Comprehensive details with in-depth charts and graphs can be seen in our full report:
Contact Us
Mike Morrone
Research Director
630-693-0645
mmorrone@hiffman.com


