January 2022
Year-End 2021 Market Watch
NAI Hiffman is pleased to present the Year-End 2021 Market Watch, a first look at the market statistics for the Chicago metropolitan office and industrial real estate markets.
Industrial: Record-Breaking Year for Net Absorption

Chicago’s industrial market continues to make headlines as it pushes toward a sub-five percent vacancy rate. The fourth quarter closed the books on 2021 with a 5.05 percent vacancy rate, tightening 23 basis points compared to the third quarter and 72 points year-over-year from 5.77 percent in 2020. The vacancy rate continued to fall during the year due to the staggering 32 million square feet of net absorption accumulated. This was in large part due to the two Amazon build-to-suit properties that were delivered and occupied in the second and third quarter of the year.
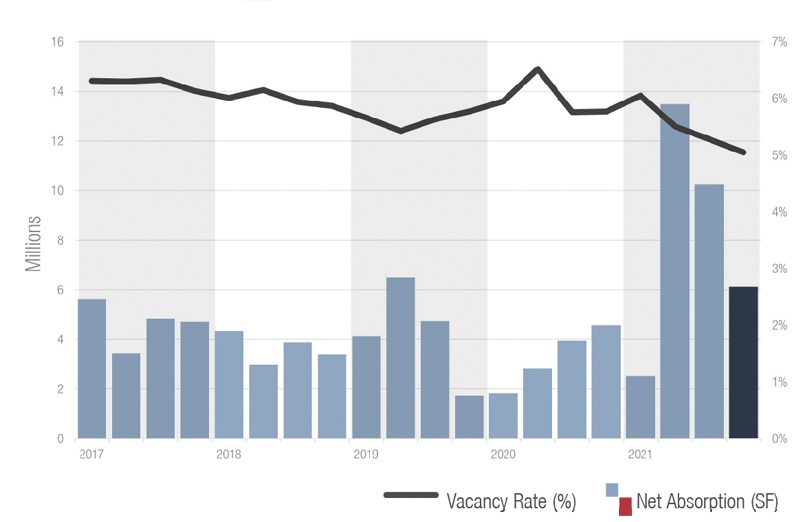
- All of the 21 submarkets maintained a vacancy rate below double-digit numbers. The I-80/Joliet Corridor surpassed Fox Valley and Southwest Cook to record the tightest vacancy rate in the market, ending Fox Valley’s claim on having the lowest vacancy rate. I-80/Joliet Corridor vacancy decreased a stunning 81 basis points from 3.31 percent in the quarter to 2.5 percent.
- Nearly 4.3 million square feet of developments were added to the market in the fourth quarter. The largest new delivery was Uline’s new 1.09 million square foot building located in Kenosha, Wisconsin accounting for all of Southeast Wisconsin’s new supply.
- Leasing activity was especially strong in the fourth quarter with a grand total of 18.68 million square feet of new leases signed. There were three deals signed over 500,000 square feet and 51 leases over 100,000 square feet.
- Although demand for industrial space continues, supply is beginning to run dry. Even though 28.5 million square feet are currently under construction across 87 properties, land is becoming scarce. In order to create more supply, developers may need to explore creative ways to assemble land or re-purpose existing or obsolete assets to create more supply.
Suburban Office: Despite Omicron, New Leasing Activity Jumps Year-Over-Year

The suburban Chicago office market recorded 1,387,293 square feet of new leasing activity in the fourth quarter, a marked 41.2 percent increase year-over-year from the 982,446 square feet of new deals tallied in the fourth quarter of 2020. With that strong finish, full-year 2021 new leasing activity outpaced 2020 by 10.2 percent overall, moving from 4,992,616 square feet to 5,501,573 square feet. Full-year new leasing activity is now only 11.3 percent below the pre-pandemic pace of 2019.
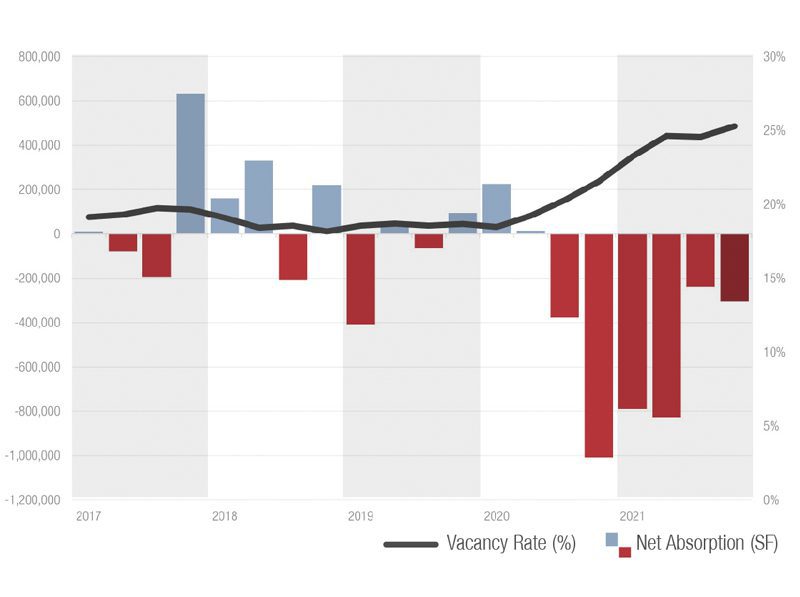
- The East-West Corridor led the way with 396,654 square feet of new deals, while the North Suburban submarket placed a strong second overall with 390,714 square feet – a 33.6 percent increase compared to the same period last year.
-
Suburban Chicago office recorded a 25.28 percent total vacancy rate in the fourth quarter, driven in part by tenants moving out of their spaces, such as Intuit’s exit of nearly 25,000 square feet at 95 W Algonquin Rd in Arlington Heights. The vacancy rate increased 72 basis points quarter-over-quarter from the 24.56 percent rate tallied in the third quarter. Year-over-year, the total vacancy rate increased 374 basis points from the 21.54 percent rate tallied at year-end 2020.
-
There was -304,212 square feet of net absorption in the suburban office market in the fourth quarter. The Northwest Suburban submarket’s net absorption figure accounted for 62.4 percent of the quarterly total. The I-55 Corridor was the only suburban submarket to tally occupancy gains in the fourth quarter, a modest 7,350 square feet. At 53,910 square feet, the Class A portion of the North Suburban submarket led its suburban peers in net absorption on the quarter. Overall there was -2,159,775 square feet of net absorption for the full year.
-
While the Delta and Omicron variants of COVID-19 added uncertainty to the market and scrambled untold return-to-work plans across the second half of 2021, the heightened pace of new leasing activity throughout the year offers a silver lining and the potential for decreasing vacancy rates in 2022.
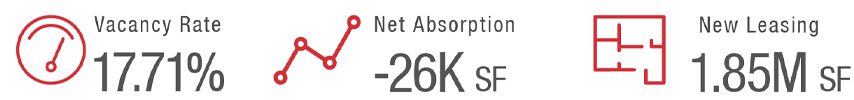
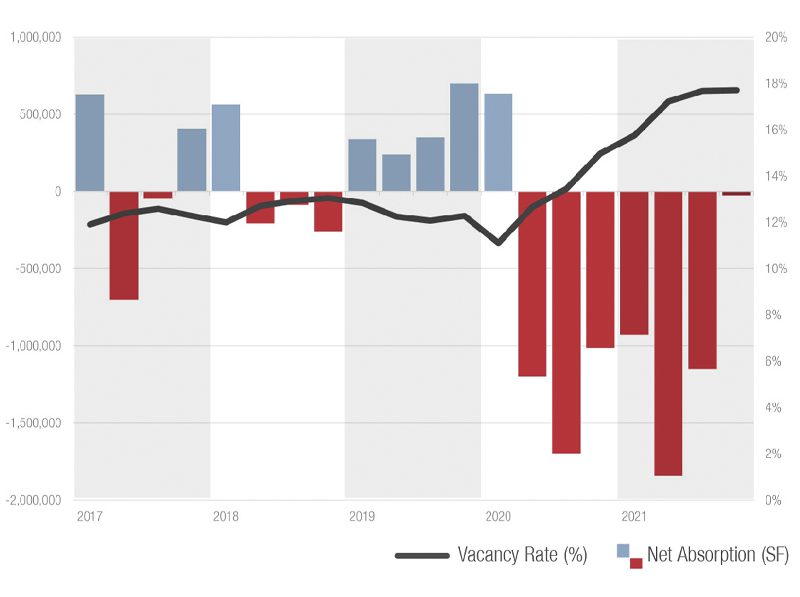
Downtown Office: Multiple New Deals Signed to End the Year Strong
-
The total vacancy rate for the downtown office market in the fourth quarter was 17.71 percent; the rate increased 4 basis points quarter-over-quarter from the 17.67 percent rate recorded during the third quarter of 2021. Additionally, the rate increased 274 basis points year-over-year from the 14.97 percent rate tallied at year end of 2020.
-
The quarter’s activity included the signing of seven deals over 50,000 square feet. Fulton Market continues to attract new tenants as two deals totaling over 180,000 square feet were signed in the fourth quarter: HAVI Global Solutions leased 96,000 square feet at 345 N Morgan St and MoLo Solutions leased 93,000 square feet at 167 N Green St.
-
Overall downtown net absorption totaled -25,603 square feet, with the marginal dip into the red marking the seventh consecutive quarter that downtown has recorded negative net absorption. Despite the negative number, the quarter’s result broke the trend of two consecutive quarters recording more than -1.0 million square feet. Year-over-year net absorption increased 96.6 percent from the -1.0 million that returned to the market in the fourth quarter of 2020.
- Although the downtown office market’s vacancy rate went up once more and net absorption was negative for the seventh consecutive quarter, strong ongoing downtown leasing activity indicates an office market searching for a light on the horizon to spark its recovery.
Contact Us
Mike Morrone
Research Director
630-693-0645
mmorrone@hiffman.com