May 2022
First Quarter 2022 Market Watch
NAI Hiffman is pleased to present the First Quarter 2022 Market Watch, a first look at the market statistics for the Chicago metropolitan office and industrial real estate markets.
Industrial: Vacancy Drops Below 5.0 Percent

Chicago’s industrial market stormed into 2022 setting more records. The total vacancy rate was 4.37 percent, edging below 5.0 percent for the first time. The rate decreased 68 basis points quarter-over-quarter from the 5.05 percent rate tallied at year-end 2021. In addition, the vacancy rate tightened 139 basis points year-over-year compared to the 5.76 percent vacancy rate from the first quarter of 2021.
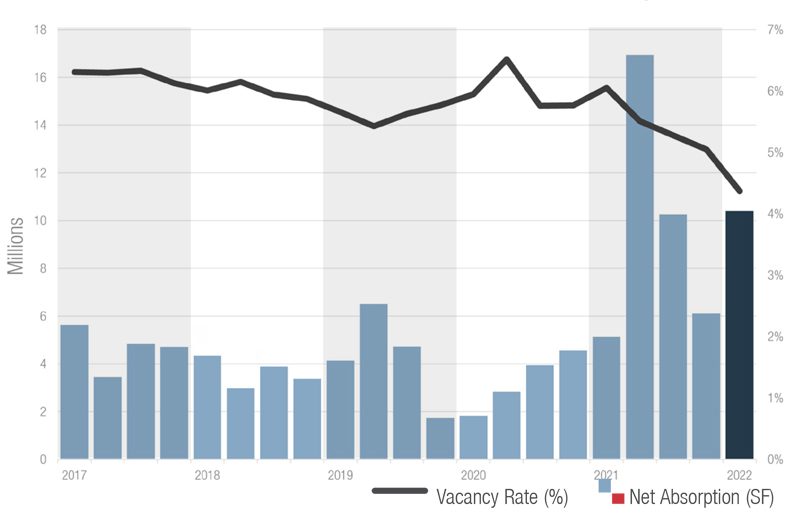
- Every submarket recorded a sub-9.0 percent vacancy rate in the first quarter, while vacancy in two submarkets edged below 2.0 percent – Southwest Cook (1.52 percent) and I-80/Joliet Corridor (1.97 percent).
- Vacancy continued its fall as a result of the more than 10.4 million square feet of net absorption recorded in the first three months of 2022. The I-55 Corridor accounted for 43.3 percent of the quarter’s net absorption figure, as eight transactions of 200,000 square feet or larger took occupancy.
- There were 14 deliveries in the construction pipeline in the first quarter, encompassing nearly 4.7 million square feet of new space. There is a record 30.5 million square feet of industrial development currently in the pipeline; build-to-suit developments account for 40.6 percent of the total figure.
Suburban Office: New Leasing Activity Jumps as COVID-19 Restrictions Ease
The suburban Chicago office market recorded 1,760,881 square feet of new leasing activity during the first quarter of 2022, a 26.31 percent increase year-over-year from the 1,394,111 square feet that was tallied during the fourth quarter of 2021. This was the best single-quarter amount of new activity since the first quarter of 2020, the last quarter not wholly affected by the Covid-19 pandemic. New leasing activity increased 74.46 percent year-over-year from the 1,009,322 square feet that was recorded during the first quarter of 2021.
- The East-West Corridor led its suburban office submarket peers with respect to new leasing activity, recording 585,151 square feet during the first quarter. Both the North Suburban and Northwest Suburban submarkets saw more than 400,000 square feet of new leasing activity.
- The quarter featured three transactions greater than 100,000 square feet: Abbot subleased 160,085 square feet at Landmark of Lake Forest II in the North Suburban market, HCSC leased 133,077 square feet at 3500 Lacey Rd in Downers Grove in the East-West Corridor, and the Federal Aviation Administration leased 115,937 square feet at Atrium in Rolling Meadows in the Northwest Suburban submarket.
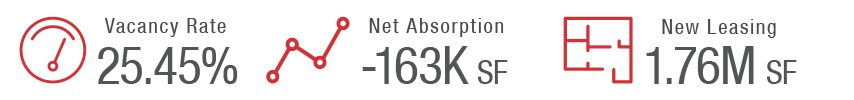
- Suburban office vacancy has yet to reflect these increases in new leasing activity though. The total vacancy rate was 25.45 percent in the first quarter. The vacancy rate increased 17 basis points quarter-over-quarter from the 25.28 percent rate tallied at year-end 2021. In addition, the vacancy rate softened 220 basis points year-over-year from the 23.25 percent rate recorded in the first quarter of 2021.
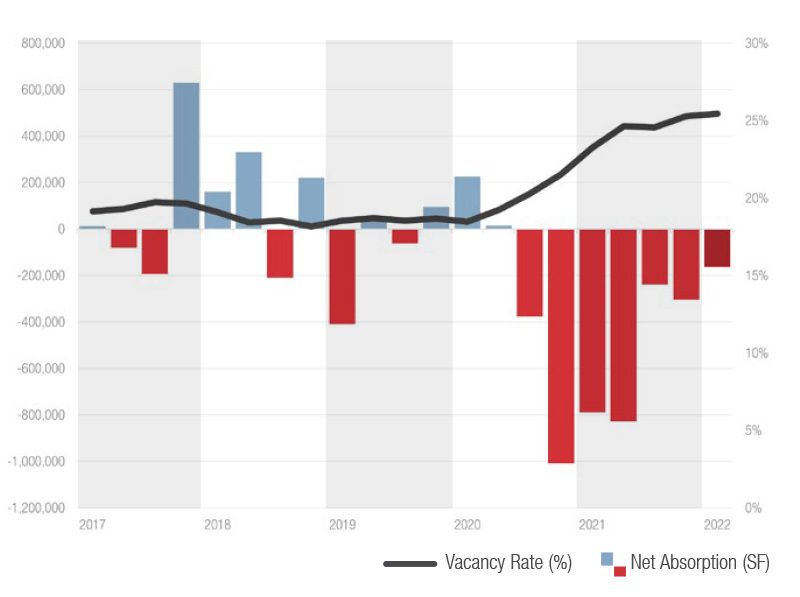
Downtown Office: CBD Hits Record Vacancy
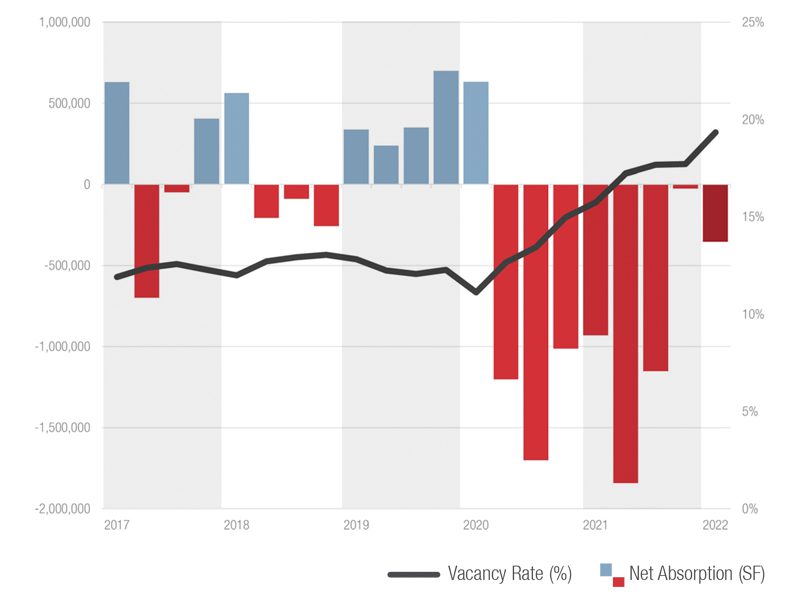
- North Michigan Avenue led its CBD office submarket peers with a 14.10 percent vacancy rate. Fulton Market was the laggard, posting a 22.83 percent vacancy rate. This rate is deceptive though, as a spate of new deliveries have spurred heightened deal activity in the trendy neighborhood. Comparatively, there are few clear positives dwelling under the surface for the vacancy rates of the Central Loop (21.79 percent) and the East Loop (21.52 percent).
-
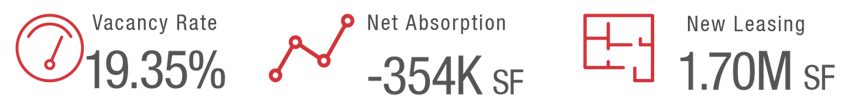
Net absorption was recorded at -354,389 square feet during the first quarter. This marks the eighth consecutive quarter that the downtown office market has tallied negative net absorption. Year-over-year figures show an improvement of 61.96 percent from the -931,663 square feet that was recorded during the first quarter of 2021.
-
There was 1,700,698 square feet of new leasing activity during the first quarter. Year-over-year figures show an increase of 93.89 percent from the 877,124 square feet that was recorded during the first quarter of 2021.
-
Although the downtown office market’s vacancy rate went up once more and net absorption was negative for the eighth consecutive quarter, the pace of demand downtown picked up in conjunction with several developments delivering. Return-to-office plans appear to finally be gaining some nascent momentum amidst a radically changed office market landscape compared to two years prior.
Contact Us
Mike Morrone
Research Director
630-693-0645
mmorrone@hiffman.com